Lithium-Ion Battery SOH Health Assessment: What It Is, Why It Matters, and How It’s Done
Every lithium-ion battery silently degrades from the moment you first charge it. The question is not if it loses capacity, but how fast and how accurately you can measure that loss. That’s exactly what State of Health (SOH) tells you.
SOH is essentially the battery’s “medical report card.” It expresses current performance as a percentage of the original factory capacity. A battery rated at 5000mAh with an SOH of 80% now delivers roughly 4000mAh. Unlike State of Charge (SOC), which tells you how much juice is left right now, SOH reveals the long-term, irreversible health of the cell. Think of SOC as your fuel gauge and SOH as the odometer on your engine.
Why SOH Assessment Is Harder Than It Looks
Here’s the uncomfortable truth: you cannot measure SOH directly. There is no sensor that reads “health percentage.” Instead, engineers infer it through models, experiments, and algorithms — each with trade-offs.
The core difficulty stems from three realities:
First, degradation is a cocktail of simultaneous reactions. SEI film growth, lithium plating, electrolyte decomposition, active material loss, and current collector corrosion all happen at once. Isolating one factor from another is nearly impossible under real-world conditions.
Second, the internal state is invisible. You cannot peek inside a sealed cell to measure electrolyte concentration, internal temperature gradients, or micro-scale structural changes. Everything must be estimated from voltage, current, and temperature data collected at the terminals.
Third, aging is non-linear and context-dependent. The same battery ages completely differently at 45°C versus 25°C, at 1C versus 0.2C discharge, and between 20%-80% SOC versus 0%-100%. Any SOH model that ignores these variables will drift off reality fast.
How SOH Is Actually Defined
There is no single universal definition, which is part of the problem. The industry uses at least four common formulations:
Capacity-based SOH (the most widely used):
SOH = C_aged / C_rated × 100%
This compares the current maximum discharge capacity to the original rated capacity. It is intuitive and practical, which is why most standards — including QC/T743-2006 from China’s automotive industry — define end-of-life as capacity dropping to 80% of nominal.
Resistance-based SOH:
SOH = (R_EOL − R_current) / (R_EOL − R_new) × 100%
Since internal resistance rises steadily as a battery ages, this approach tracks the same degradation from a different angle. The catch? Resistance varies with SOC, temperature, and measurement frequency, making it tricky to use alone.
Energy-based SOH looks at total discharge energy rather than capacity, accounting for the fact that voltage curves shift as cells age.
Remaining cycle count SOH estimates health based on how many useful cycles are left versus total design life. This is the least reliable because total cycle life cannot be predicted accurately upfront.
Capacity and energy definitions dominate in practice because they are measurable and reproducible. Resistance and cycle-count definitions remain mostly in research labs.
The Main Factors That Crush Your Battery’s SOH
Understanding what kills SOH helps you understand what SOH assessment is actually trying to capture.
Temperature: The Silent Accelerator
Heat is the single biggest enemy. Experimental data shows that elevated temperatures accelerate SEI film growth on the anode, which thickens the barrier lithium ions must cross — effectively increasing internal resistance. At 45°C, degradation rates can spike by up to 300% compared to room temperature. Even modest heat during fast charging compounds the damage because high current density generates internal heat, which speeds up every parasitic reaction happening inside.
Charge and Discharge Rate
A Sony 18650 cell tested at three different discharge rates over 300 cycles showed stark differences: at the highest rate, capacity dropped 16.9% and internal resistance climbed 27.7%. At the lowest rate, those numbers were 9.5% and 12.4% respectively. High-rate cycling also produces thicker SEI layers visible under electron microscopy. The takeaway: fast charging is not free — it costs SOH.
Depth of Discharge and Voltage Window
Cycling between 0% and 100% SOC is far more damaging than staying within 20%-80%. Research shows that when capacity has already faded to 85%, deep cycling actually outperforms shallow cycling in total energy throughput — but only in that narrow window. Below 85% SOH, shallow cycling wins. The sweet spot for longevity is keeping SOC between 20% and 80%, which reduces both mechanical stress on electrode particles and unwanted side reactions at extreme voltages.
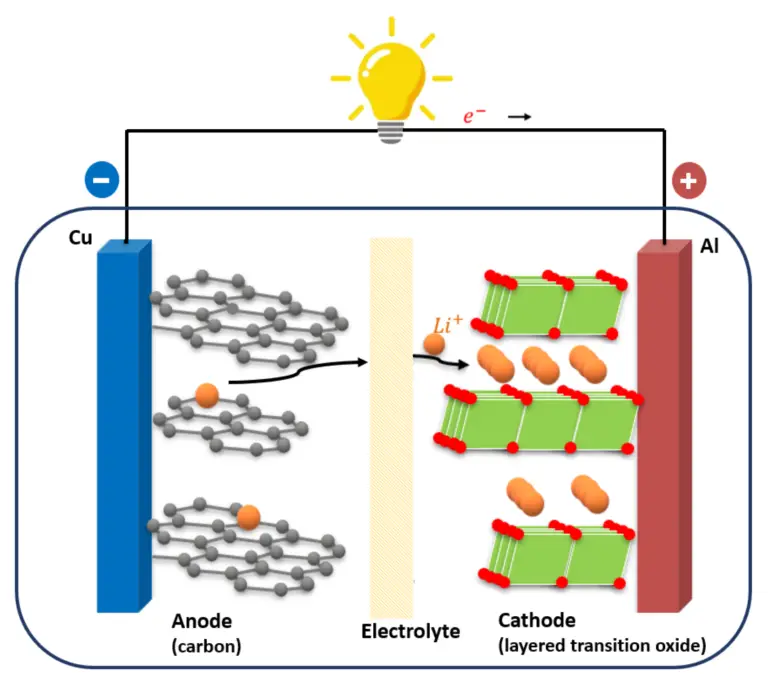
Over-discharge below the cutoff voltage causes copper current collector dissolution and graphite anode collapse. Over-charge above the upper voltage limit triggers lithium plating on the anode — metallic lithium that can never be cycled again and, worse, can grow into dendrites that pierce the separator.
SOH Estimation Methods: From Lab to Real World
Electrochemical Models
These dig into the physics: SEI growth kinetics, lithium diffusion equations, Butler-Volmer reaction rates. They are the most accurate in theory but require parameters that are extremely hard to measure inside a real cell. Mostly used in R&D, not in production BMS.
Equivalent Circuit Models
The Rint, RC, and Thevenin models treat the battery as a network of resistors and capacitors. Combined with Kalman filtering, they can estimate SOH in real time from voltage and current data. PNGV and GNL are refined versions built on Thevenin. These are the workhorses of modern battery management systems.
Data-Driven and Machine Learning Approaches
Neural networks (LSTM, Bi-LSTM-AM), Gaussian process regression, support vector machines, and random forests are increasingly used to map voltage/current/temperature histories to SOH values. Tesla’s BMS reportedly uses variants of this approach. Recent work shows Bi-LSTM-AM models can achieve SOH estimation errors below 1.5%. The downside: they need massive training datasets and struggle to generalize across cell types.
Incremental Capacity and Voltage Analysis
ICA and DVA extract features from the differential of charge/discharge curves — peak positions, heights, areas. These features correlate strongly with SEI thickness, active material loss, and lithium inventory. The method is powerful but traditionally offline; making it work online remains an active research area.
Practical SOH Thresholds and What They Mean
For most professional applications, capacity below 80% of rated value means the pack has reached end of life. In the electric vehicle world, warranty coverage typically kicks in while SOH stays above 70%-80%. Retired EV batteries with SOH between 60% and 80% often find second lives in stationary energy storage — a second act that only works because someone measured SOH accurately enough to know the battery was still useful.
For consumer electronics, the degradation curve is not linear. SOH tends to drop faster in the first two years, then gradually levels off. A well-maintained quality cell can stay above 80% SOH for five years or more.
What You Can Actually Do to Slow SOH Decline
The research is clear on this:
- Keep the battery between 20% and 80% SOC as much as possible.
- Avoid charging or discharging at high rates when you can help it.
- Stay out of extreme heat — above 45°C is where degradation goes off a cliff.
- Run a full charge-discharge cycle every three to six months to let the BMS recalibrate its SOH estimate.
- Use the original charger whenever possible. Third-party chargers with unstable current output accelerate wear, especially lithium plating during fast charge.
SOH is not a number you can see on your phone screen yet — but it is the number that determines whether your battery dies next month or next year. The better the assessment, the better you can manage it.