Standard for Matching Charging and Discharging Rates of Lithium-ion Batteries
Lithium-Ion Battery C-Rate Matching Standards: What Engineers Actually Need to Know
Every lithium-ion battery spec sheet throws around the letter “C” like it means something obvious. It does — but only if you know the rules behind it. The charge and discharge C-rate is not just a number. It is the single most important parameter that determines whether your battery pack lives for five years or dies in eighteen months. And yet, most system integrators treat it as an afterthought.
The reality is harsh: mismatched C-rates between cells, between charge and discharge, or between your battery and your BMS will silently destroy capacity, accelerate degradation, and in the worst case, turn your pack into a thermal event. This is what the actual standards say — and what they leave out.
What C-Rate Actually Means (And Why the Math Matters)
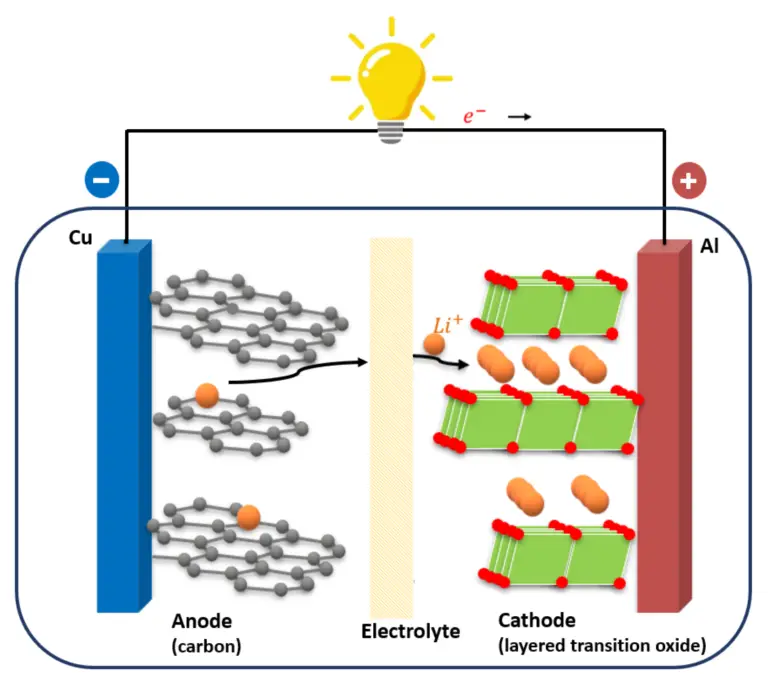
C-rate is the ratio of charge or discharge current to the battery’s rated capacity. Simple formula:
C-rate = Charge/Discharge Current (A) ÷ Rated Capacity (Ah)
A 2000mAh cell discharged at 2A is running at 1C. Same cell at 10A is 5C. At 400mA, it is 0.2C. The number tells you how fast energy moves in or out relative to what the cell can hold.
Here is where confusion creeps in. The rated capacity itself changes with C-rate. A cell rated at 10Ah at 0.2C might only deliver 9.5Ah at 1C and barely 7Ah at 5C. The faster you pull, the less you get. This is not a flaw — it is physics. Lithium-ion diffusion has speed limits, and every C-rate above 1C eats into usable capacity.
Test data makes this brutally clear. At 1C discharge, capacity retention sits around 95%. Crank it to 3C and you drop to 82%. Push to 5C and you lose more than 30% of rated capacity. At 10C, you are harvesting roughly 70% of what the label promises. At 20C, it falls to 85% of the 1C value. The curve is not linear. It collapses.
Industry Standards That Govern C-Rate Matching
There is no single universal standard that says “your C-rate must be X.” Instead, a patchwork of international standards defines how C-rate must be tested, reported, and matched to application.
UL 2580 and IEC 62133: The Safety Backbone
UL 2580, adopted as an American National Standard through ANSI, evaluates energy storage systems under simulated abuse conditions. It does not just test whether the battery catches fire. It tests whether charge and discharge parameters remain reliable across the operating temperature range. This means the C-rate you specify on paper must actually be sustainable under real thermal stress.
IEC 62133 covers secondary lithium cells and batteries for portable applications. It mandates that manufacturers report capacity at a defined C-rate — typically 0.2C for the rated capacity figure, with discharge performance verified at 0.2C, 0.5C, and 1C. If a datasheet claims 3000mAh but only measured it at 0.2C, that number is technically correct but practically misleading for anyone running at 1C or higher.
UN 38.3: The Transport Gatekeeper
Before any lithium battery ships by air, sea, or road, it must pass UN 38.3 testing — eight test procedures labeled T1 through T8. These include altitude simulation, thermal cycling, vibration, shock, and short circuit. The discharge portions of these tests are run at specific C-rates, and failure at those rates means the cell never leaves the factory. This is the baseline that every OEM must clear before anything else matters.
GB 31241 and GB/T 28164: China’s Mandatory Framework
For cells sold in the Chinese market, GB 31241 is mandatory. It covers safety requirements for lithium batteries and cells used in portable electronic products. GB/T 28164 applies to battery packs and systems. Both standards require C-rate testing at multiple levels and define overcharge, over-discharge, and short-circuit protection thresholds relative to the rated C-rate. A cell rated for 1C discharge must have protection circuits that trigger well before you exceed that current.
How to Match Charge and Discharge C-Rates in Practice
The Golden Rule: Charge C-Rate Should Not Exceed Discharge C-Rate
This sounds obvious. It is not. In many EV and drone applications, engineers spec a 3C discharge cell but pair it with a 1C charger, or worse, a 2C fast charger. The mismatch creates asymmetric degradation.
Discharge at high C-rate thins the SEI layer on the anode and accelerates lithium plating risk during the subsequent charge. If you then charge at a high C-rate on top of that, you are compounding damage. The data is unambiguous: cycling between 25% and 75% SOC at 1C discharge and 0.3C charge delivers 2000 cycles before hitting 80% capacity. Full 0% to 100% cycling at the same rates drops that to 500 cycles. Shallow cycles at low C-rates are not a nice-to-have. They are the entire game.
For storage applications, 0.5C has become the de facto standard for a reason. A 200kWh or 215kWh cabinet paired with a 100kW PCS charges or discharges fully in roughly two hours. That window aligns with peak-valley electricity pricing periods in most grids. Going faster wastes power. Going slower wastes time. The 0.5C sweet spot is not arbitrary — it is economically optimized.
Cell-to-Cell Consistency Is the Hidden C-Rate Killer
In a series string, the weakest cell dictates the pack’s C-rate ceiling. If one cell in a 100-cell series has an internal resistance 20% higher than the rest, it will hit voltage limits first during discharge and overcharge first during charging. The BMS will then throttle the entire pack to protect that one cell. Your 5C-rated pack suddenly performs like a 2C pack.
Parallel groups face a different problem. Cells with mismatched internal resistance do not share current equally. The low-resistance cell discharges first, the high-resistance cell never fully empties, and you lose usable capacity on every cycle. This is why “group balancing” — monitoring each parallel unit independently — is not optional in any serious pack design.
Temperature Is the C-Rate Multiplier Nobody Talks About
A cell rated for 3C at 25°C may only safely handle 1.5C at 40°C. Internal resistance drops as temperature rises, which sounds good for power delivery. But the SEI layer degrades faster, lithium plating risk spikes during charging, and thermal runaway threshold drops. Above 60°C, high C-rate discharge becomes genuinely dangerous.
Conversely, at low temperatures, lithium-ion diffusion slows dramatically. A cell that gives 100% capacity at 1C and 25°C might deliver only 60% at 1C and -10°C. The BMS must dynamically adjust C-rate limits based on real-time temperature, not just static lookup tables.
What the Data Says About C-Rate and Cycle Life
The trade-off between C-rate and longevity is not a suggestion. It is a law of electrochemistry.
At 1C discharge with 0.3C charge, expect roughly 500 cycles to 80% capacity under full depth-of-discharge cycling. Drop to 0.5C discharge and you can push past 700 cycles. Restrict cycling to 50%–100% SOC at 1C discharge and you reach 1800 cycles. At 25%–75% SOC, the same protocol delivers 2000 cycles. The lower the C-rate and the shallower the cycle, the longer the battery lives. There is no workaround.
Fast charging — defined in the industry as anything above 1.6C, or roughly 0% to 80% in under 30 minutes — adds its own penalty. Charging at 2C or 3C accelerates capacity fade compared to 0.5C charging. One study showed that 0.5C charged cells dropped below 80% capacity after just 15 overcharge cycles, while 2C and 3C charged cells degraded more slowly under overcharge conditions. The mechanism is complex: at very low charge rates, lithium has more time to plate on the anode surface, causing irreversible loss. At higher charge rates, the kinetic competition shifts. This counterintuitive result means that C-rate matching is not just about matching charge to discharge — it is about understanding which direction of current flow causes which type of damage.
Matching C-Rate to Real Applications
Not every application needs the same C-rate, and forcing a high-C cell into a low-C role wastes money and adds unnecessary degradation risk.
Drones and RC models routinely use 20C to 40C discharge cells because they need instantaneous current bursts for motor acceleration. The trade-off is short cycle life — often under 300 cycles — but the device is replaced before the battery dies.
Electric vehicles target 1C to 3C discharge with 1C to 2C fast charging capability. The BMS manages SOC windows dynamically: high C-rate discharge during acceleration, low C-rate charging during grid-valley periods. This adaptive strategy is what makes EV batteries last 8–10 years despite daily high-power use.
Grid storage sits at 0.5C to 1C for both charge and discharge. The priority is cycle life — 5000 to 10000 cycles over 10+ years — not burst power. Pushing a storage cell to 3C to shave minutes off a charge cycle will cost you thousands of cycles in lifespan. The math never favors speed here.
Portable electronics operate at 0.2C to 0.5C discharge, with charging typically at 0.3C to 0.5C. A 10000mAh power bank rated at 0.3C discharge delivers 3A max — more than enough for any phone or tablet. There is zero reason to over-spec C-rate in this category.
The bottom line is this: C-rate matching is not about finding the highest number your cell can handle. It is about finding the highest number your application actually needs, and then building every protection, thermal, and balancing system around that number. Everything else is engineering theater.